Personal Intelligence
Turning a personal photo library into an interactive knowledge graph of place, time, and attention.
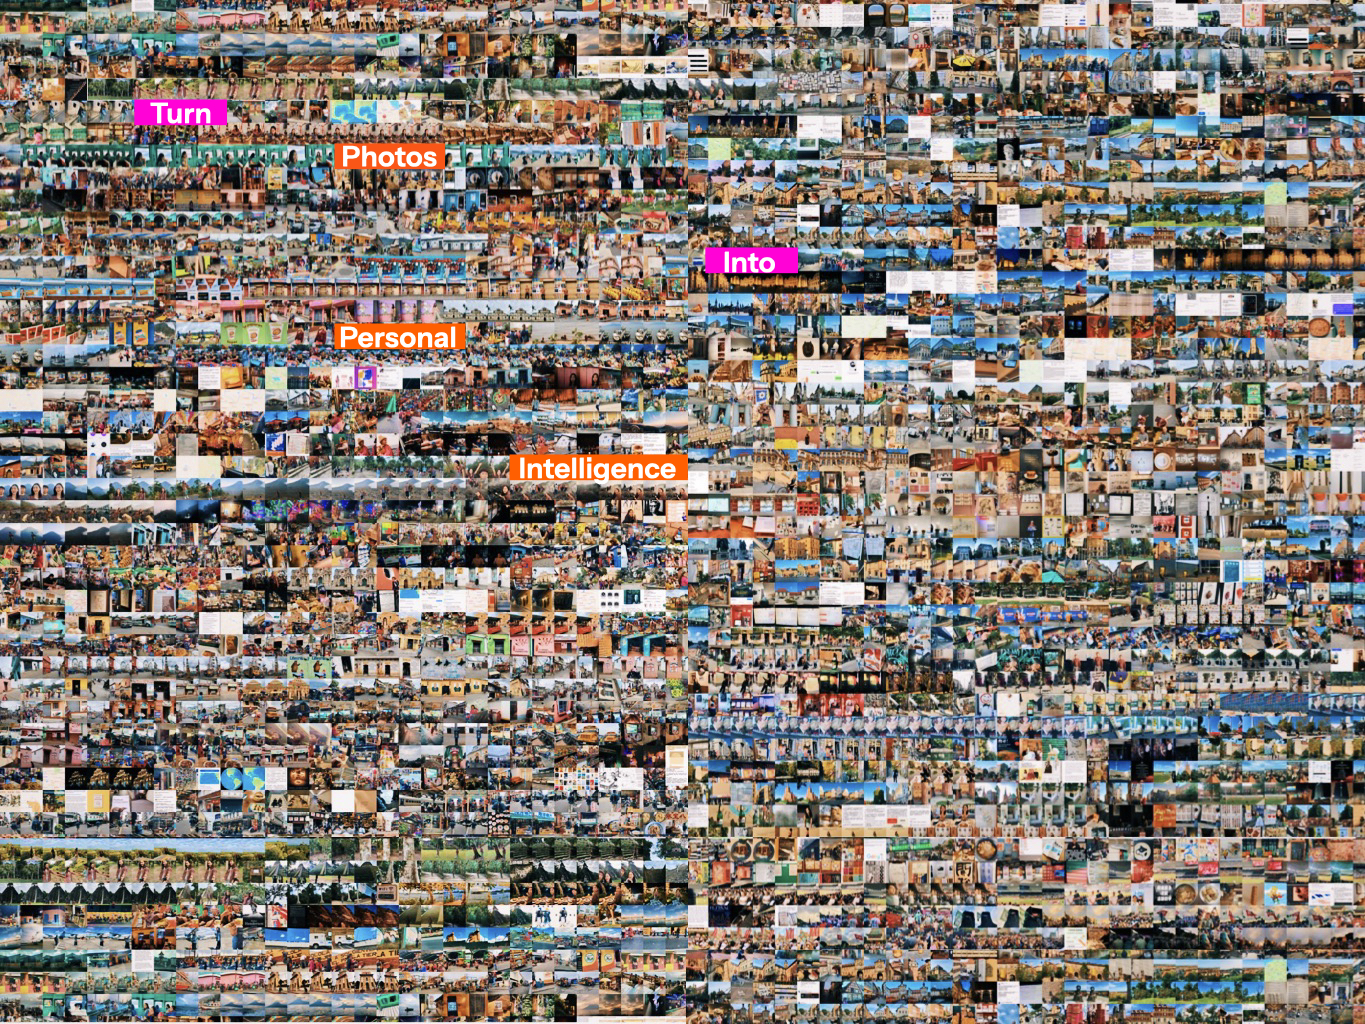
What insights can a photo archive reveal about personal spatial experience?
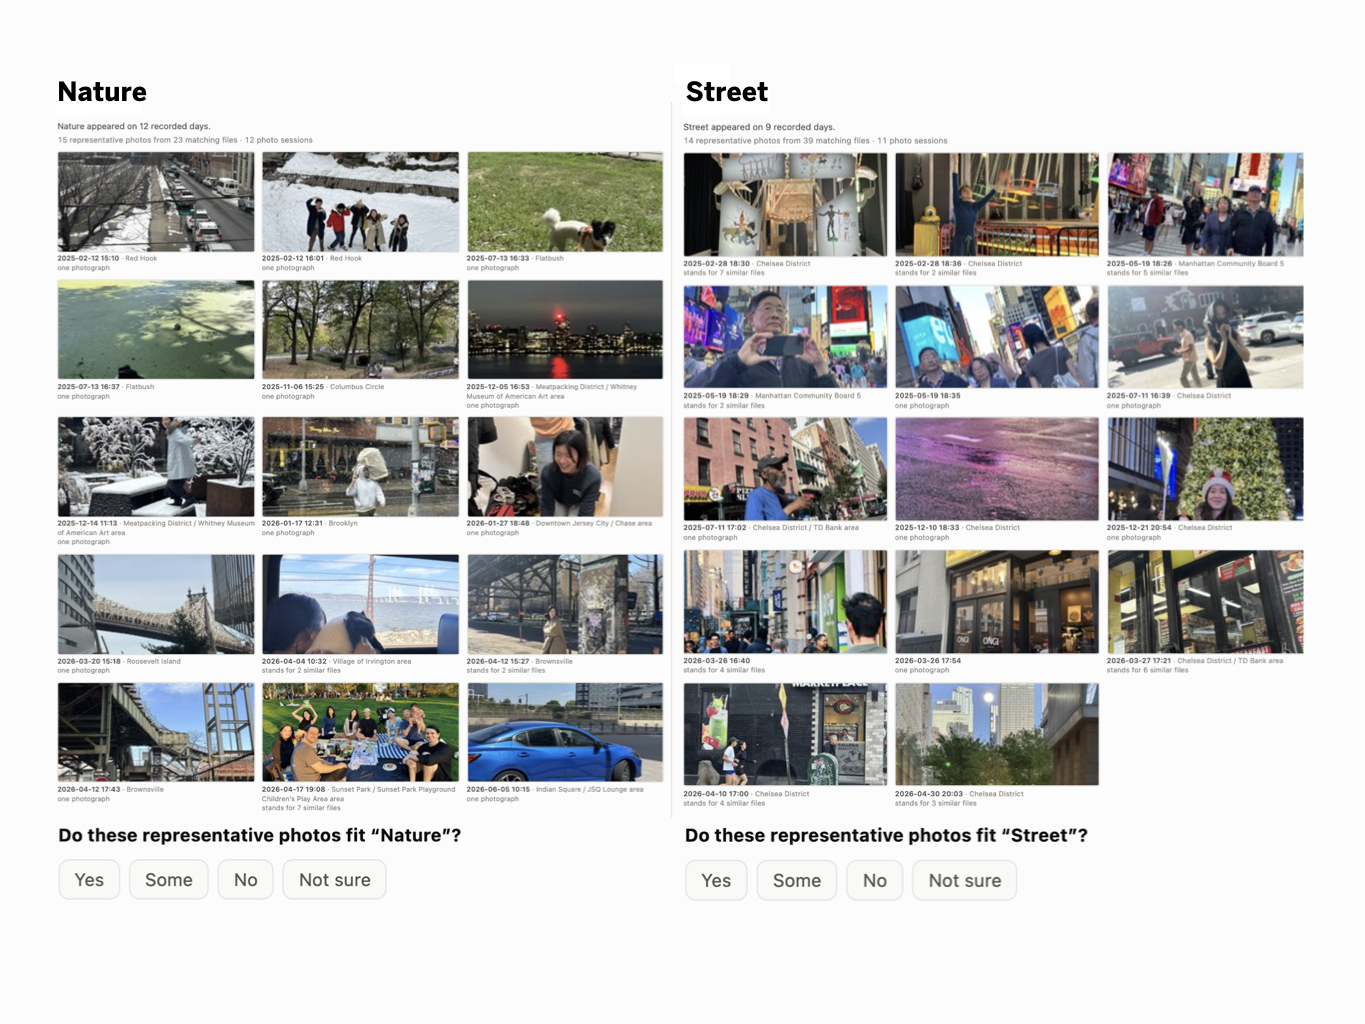
By connecting past movement patterns with future interests, we could discover where to go next, with less time spent planning and traveling.
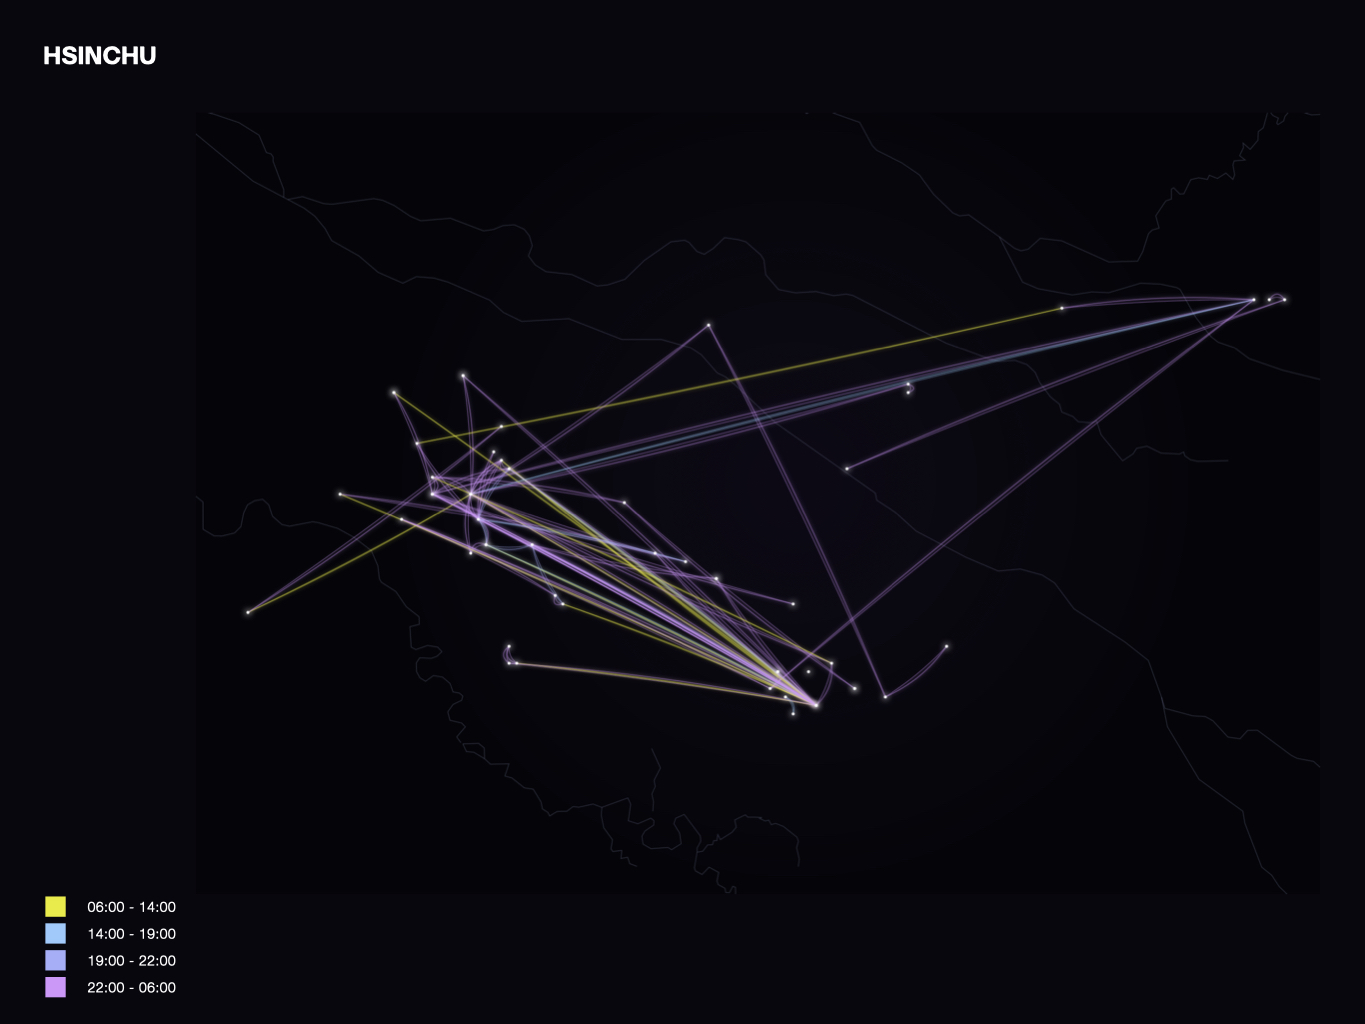
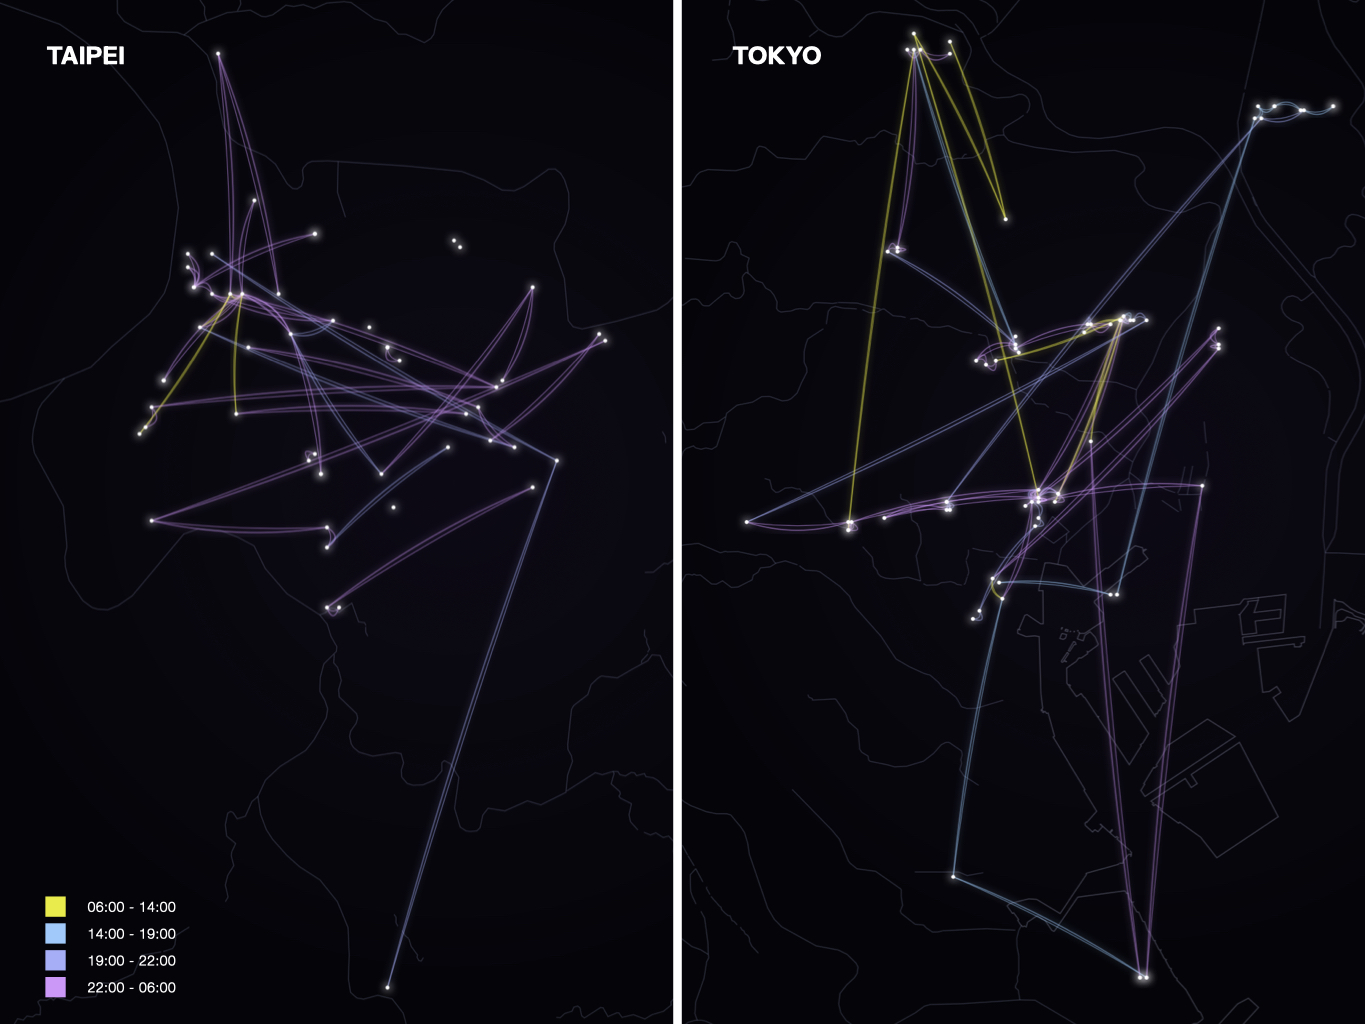
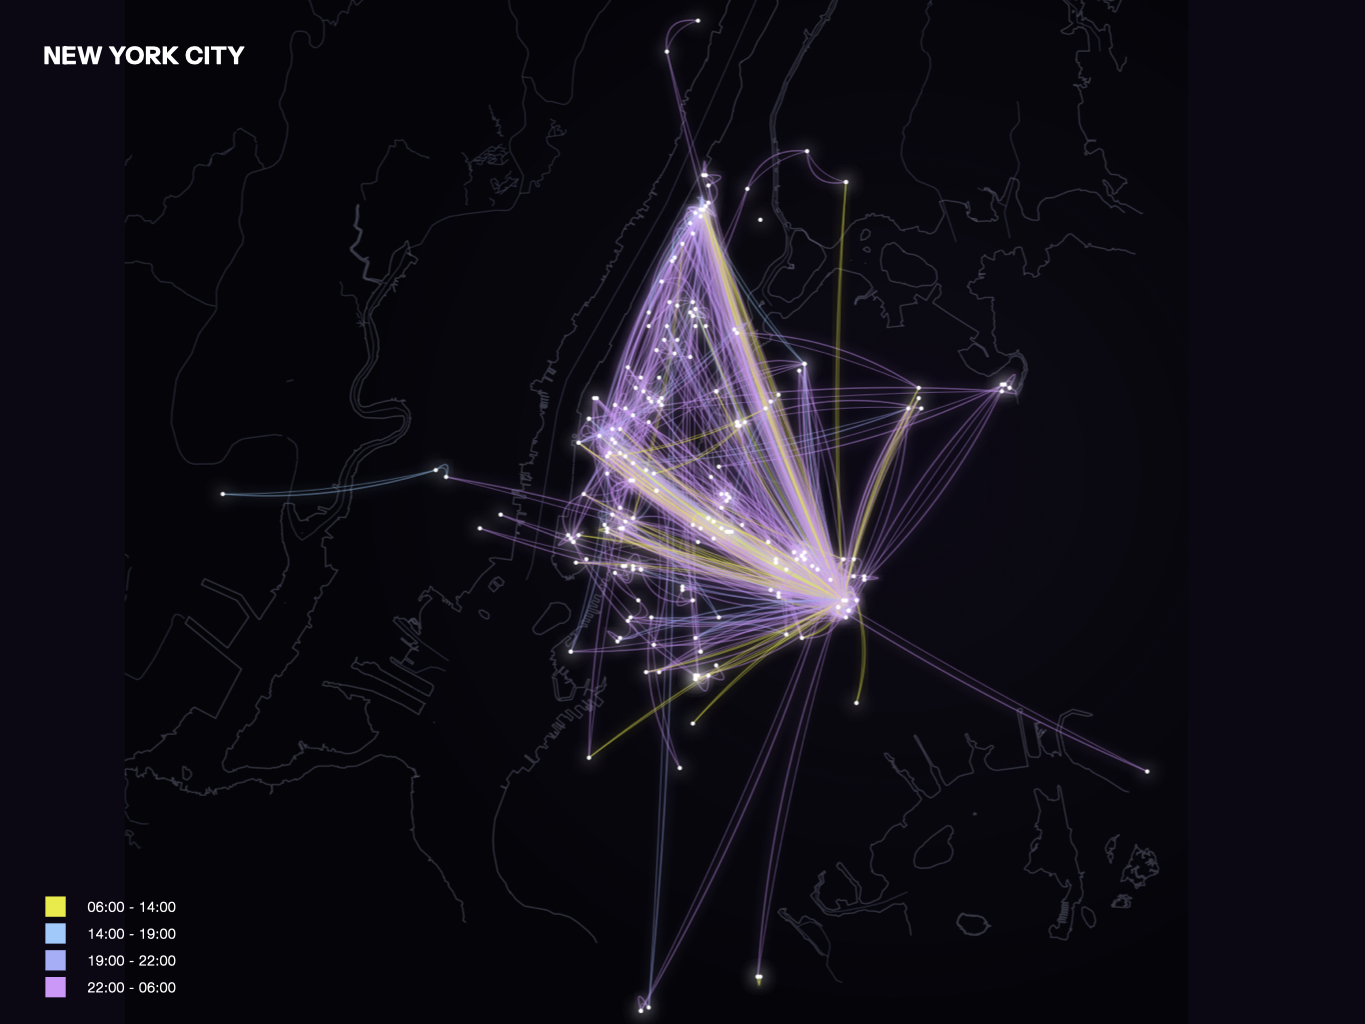
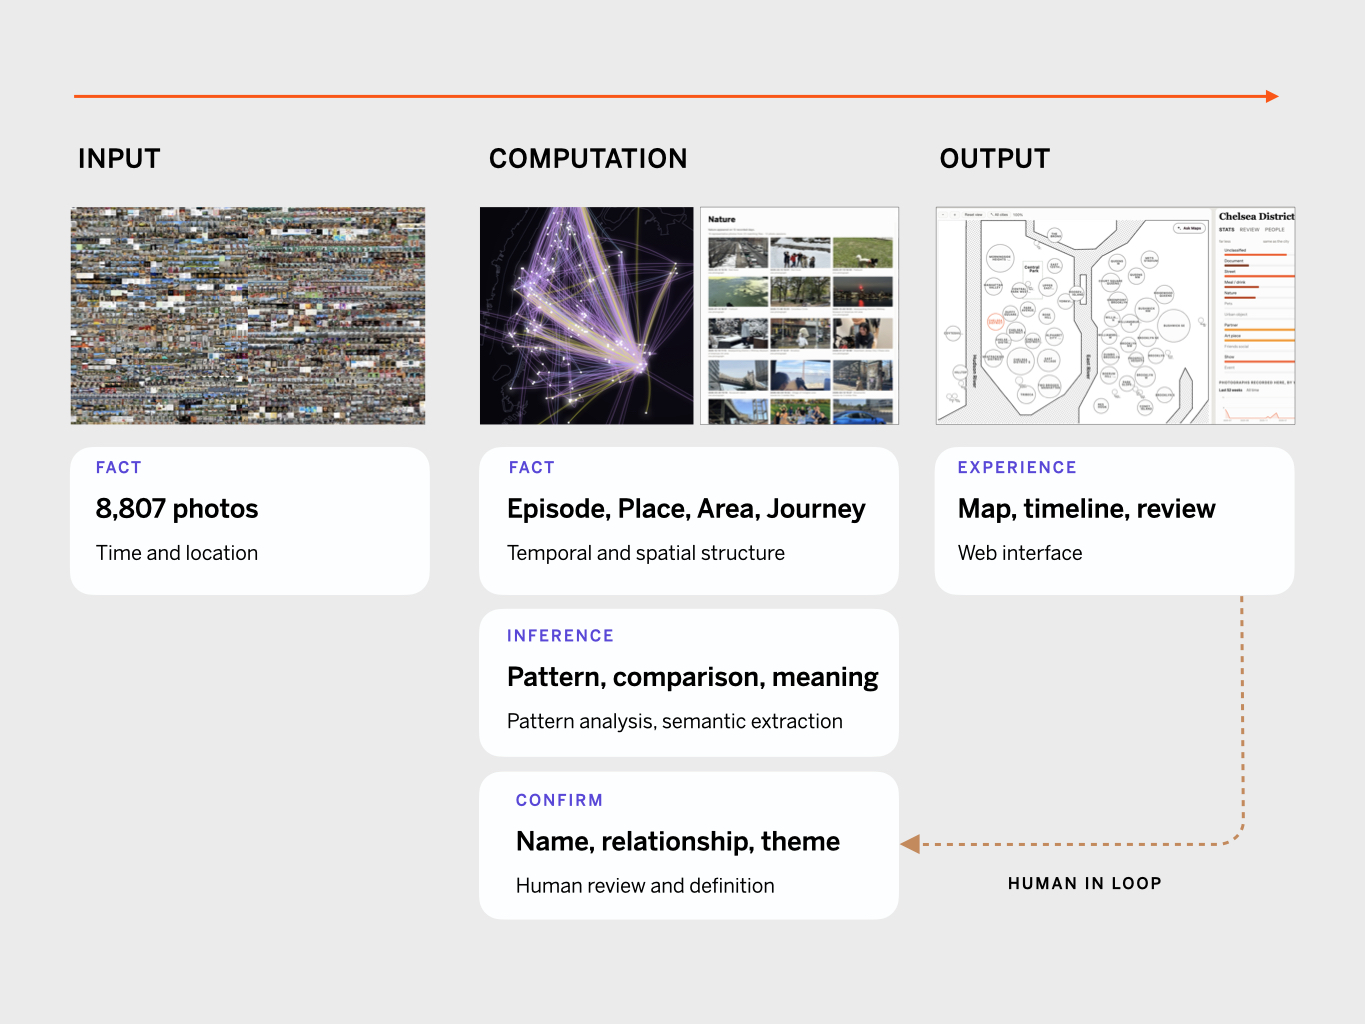
Today's AI builds its memory of a user from conversations and tool logs, and knows nothing about where that person spends time or what they notice there. This project reads the photo library people already produce every day to supply that missing layer, so real world patterns become readable and actionable.
This project turns a personal phone photo library into an interactive knowledge graph of place and time. Photo content, capture time, location, visit frequency and the user's own annotations become a map with places, areas and journeys of where a life actually happened: the places a person went, the routes he/she repeated, and how his/her attention shifted over time.
Challenge
A photo library is the largest, most truthful, and least structured record of personal behaviours most people own. This project turns it into a spatial and temporal foundation layer for personal intelligence. The first version concentrated on three design challenges:
1. Defining rules to de-noise the library. Excluding bursts of the same subject shot in sequence, excluding screenshots, and accounting for GPS drift, so that photos cluster into areas rather than raw coordinates.
2. Extracting insight and meaning from photo content and spatial traces. without becoming a life-log or a location map. Every insight has to be traceable and explainable, which means the LLM must not speculate, fabricate, or over-infer.
3. Privacy, and control over definitions. Personal photos are highly sensitive data, so the architecture cannot send anything to the cloud by default. User should also feel controllable to identify people and residency in photos, along with the relationships.
Solution
The interface is mainly composed of three layers:
Map. Composed of Place, Area, and City, with Episode and Journey threading them across time. Less about where things are but what a space means to the person and how they move through it.
Timeline. The same place is a different thing at different scales. Read from a single day up to a year, returns, stays, and repeat frequency reveal the type and meaning of a space.
Semantics. Eleven photo themes (meal/drink, show, pets, partner, document, street, friends/social, urban object, nature, event, art piece) define where attention lands, and make spatial experience comparable. A conversational interface combines all three layers to answer questions like "What does this city mean to me?", which other applications like maps, photo, and location trackers cannot.
There are also two experience principles worth mention:
Human in the loop. People, relationships, and theme labels only affect the map once the user confirms them.
Privacy and explainability. The system runs local-first; the generation endpoint never reads the photos, and every summary traces back to evidence.
Learning
1. Meaning comes from human judgement. Define and articulate the best output first, then update the data structure.
The key challenges was turning analysis into statements that are credible, specific, and actionable without over-inferring. I wrote 15 to 20 acceptable sentence patterns and the content types to avoid, then went back and changed the data structure or created new dataset if necessary, so the model could only receive material capable of supporting those sentences. What is achievable gets specified by the designer, not produced by self-generating.
2. People and machines do not read the same thing.
A machine needs the complete graph in order to generate anything evidence-grounded. People find it hard to get meaningful comparison or insight out of a graph; what they need is closer to narrative design.
3. Meaning comes from comparison, not from numbers.
People reach meaning more easily through contrast: how did my rhythm and focus in Bushwick differ from Tokyo this year? To answer that, I defines six indexes, each comparing one area against the average of the person's other areas: Spatial Range, Activity Rhythm, Exploration, Social Presence, Attention Distribution, and Routine Stability. Every sentence generated can then point back to a difference that is measurable and traceable.
4. A classification scheme has to consider of the limits of its own explanation.
Handing the power of definition to the user avoids AI over-inference, but it carries the opposite risk: when new data arrives, it must not be constrained by the theme categories and structure that already exist. Interests that fall outside the current definitions need a chance to surface, rather than disappearing into unclassified. This is still an open problem for my next refinement.
Vision
1. Turn the knowledge graph into a decision making tool with agents AI approach. Applied to travel planning, getting around, and social arrangements, so that personal intelligence delivers real value. Also, the system can meaningfully understand how its suggestions play out in physical space.
2. Capture attentions beyond the photo library. Saved map locations, calendars, phone screenshots, compared against the existing traces, to analyse future choices of time and place. For example, matching restaurants saved on a map against past movement patterns to find the option with the lowest cost in time and travel. This direction is not yet validated but my interests in the next project scope.